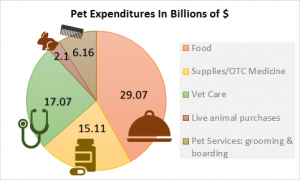
Did you know? It appears most Americans choose to surround themselves with pets. According to the APPA , 68% of U.S. households include pets. In 2017 Americans spent 69.5$ billion on their pets. Close to 70% more than spent in 2007. The breakdown of pet expenditures for 2017 is presented below:
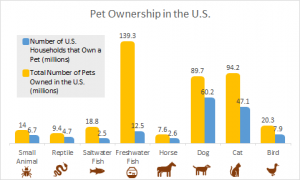
While more American households own dogs (60.2M) than cats (47.1M), there are more pet cats (94.2M) than dogs (89.7M) in the US. It may also surprise you to hear that Americans own more freshwater fish (139.3M) than any other pet. Americans also own 20.3M birds, 7.6M horses, 158.1M fish, 9.4M reptiles and 14M more small animals.
According to the 2017-2018 APPA National Pet Owners Survey, on average, cat and dog owners spend more on surgical and routine vet visits than anything else.
These numbers represent the ever-growing love for our pet companions. How do you and your loves ones fit into this story?
For any more questions or insights feel free to leave a comment.
Source: http://www.americanpetproducts.org/press_industrytrends.asp